← Back to Blogs
Amazon Ads
12 min read
Why Is My TACoS Going Up But Sales Are Flat? Renting Versus Growing

Onieque Edwards
Content Strategist /Blog Writer

Why Is My TACoS Going Up But Sales Are Flat? Renting Versus Growing
The ad invoice climbs every month. Total sales sit roughly where they sat in the spring. Nothing looks broken, and the number everyone reaches for to explain it is TACoS.
TACoS is total advertising cost of sales. Ad spend divided by total sales, across the whole business rather than the ads on their own. ACoS asks what the ads cost against the sales the ads produced. TACoS asks what they cost against everything you sold, paid and organic together. That second question notices when advertising starts carrying revenue the listing used to carry by itself.
The pattern has at least five causes, and four of them get worse if you treat the number as the problem.
Does Amazon show TACoS anywhere? No, and the two halves live on separate screens
Start here, because most of the confusion downstream comes from this one fact.
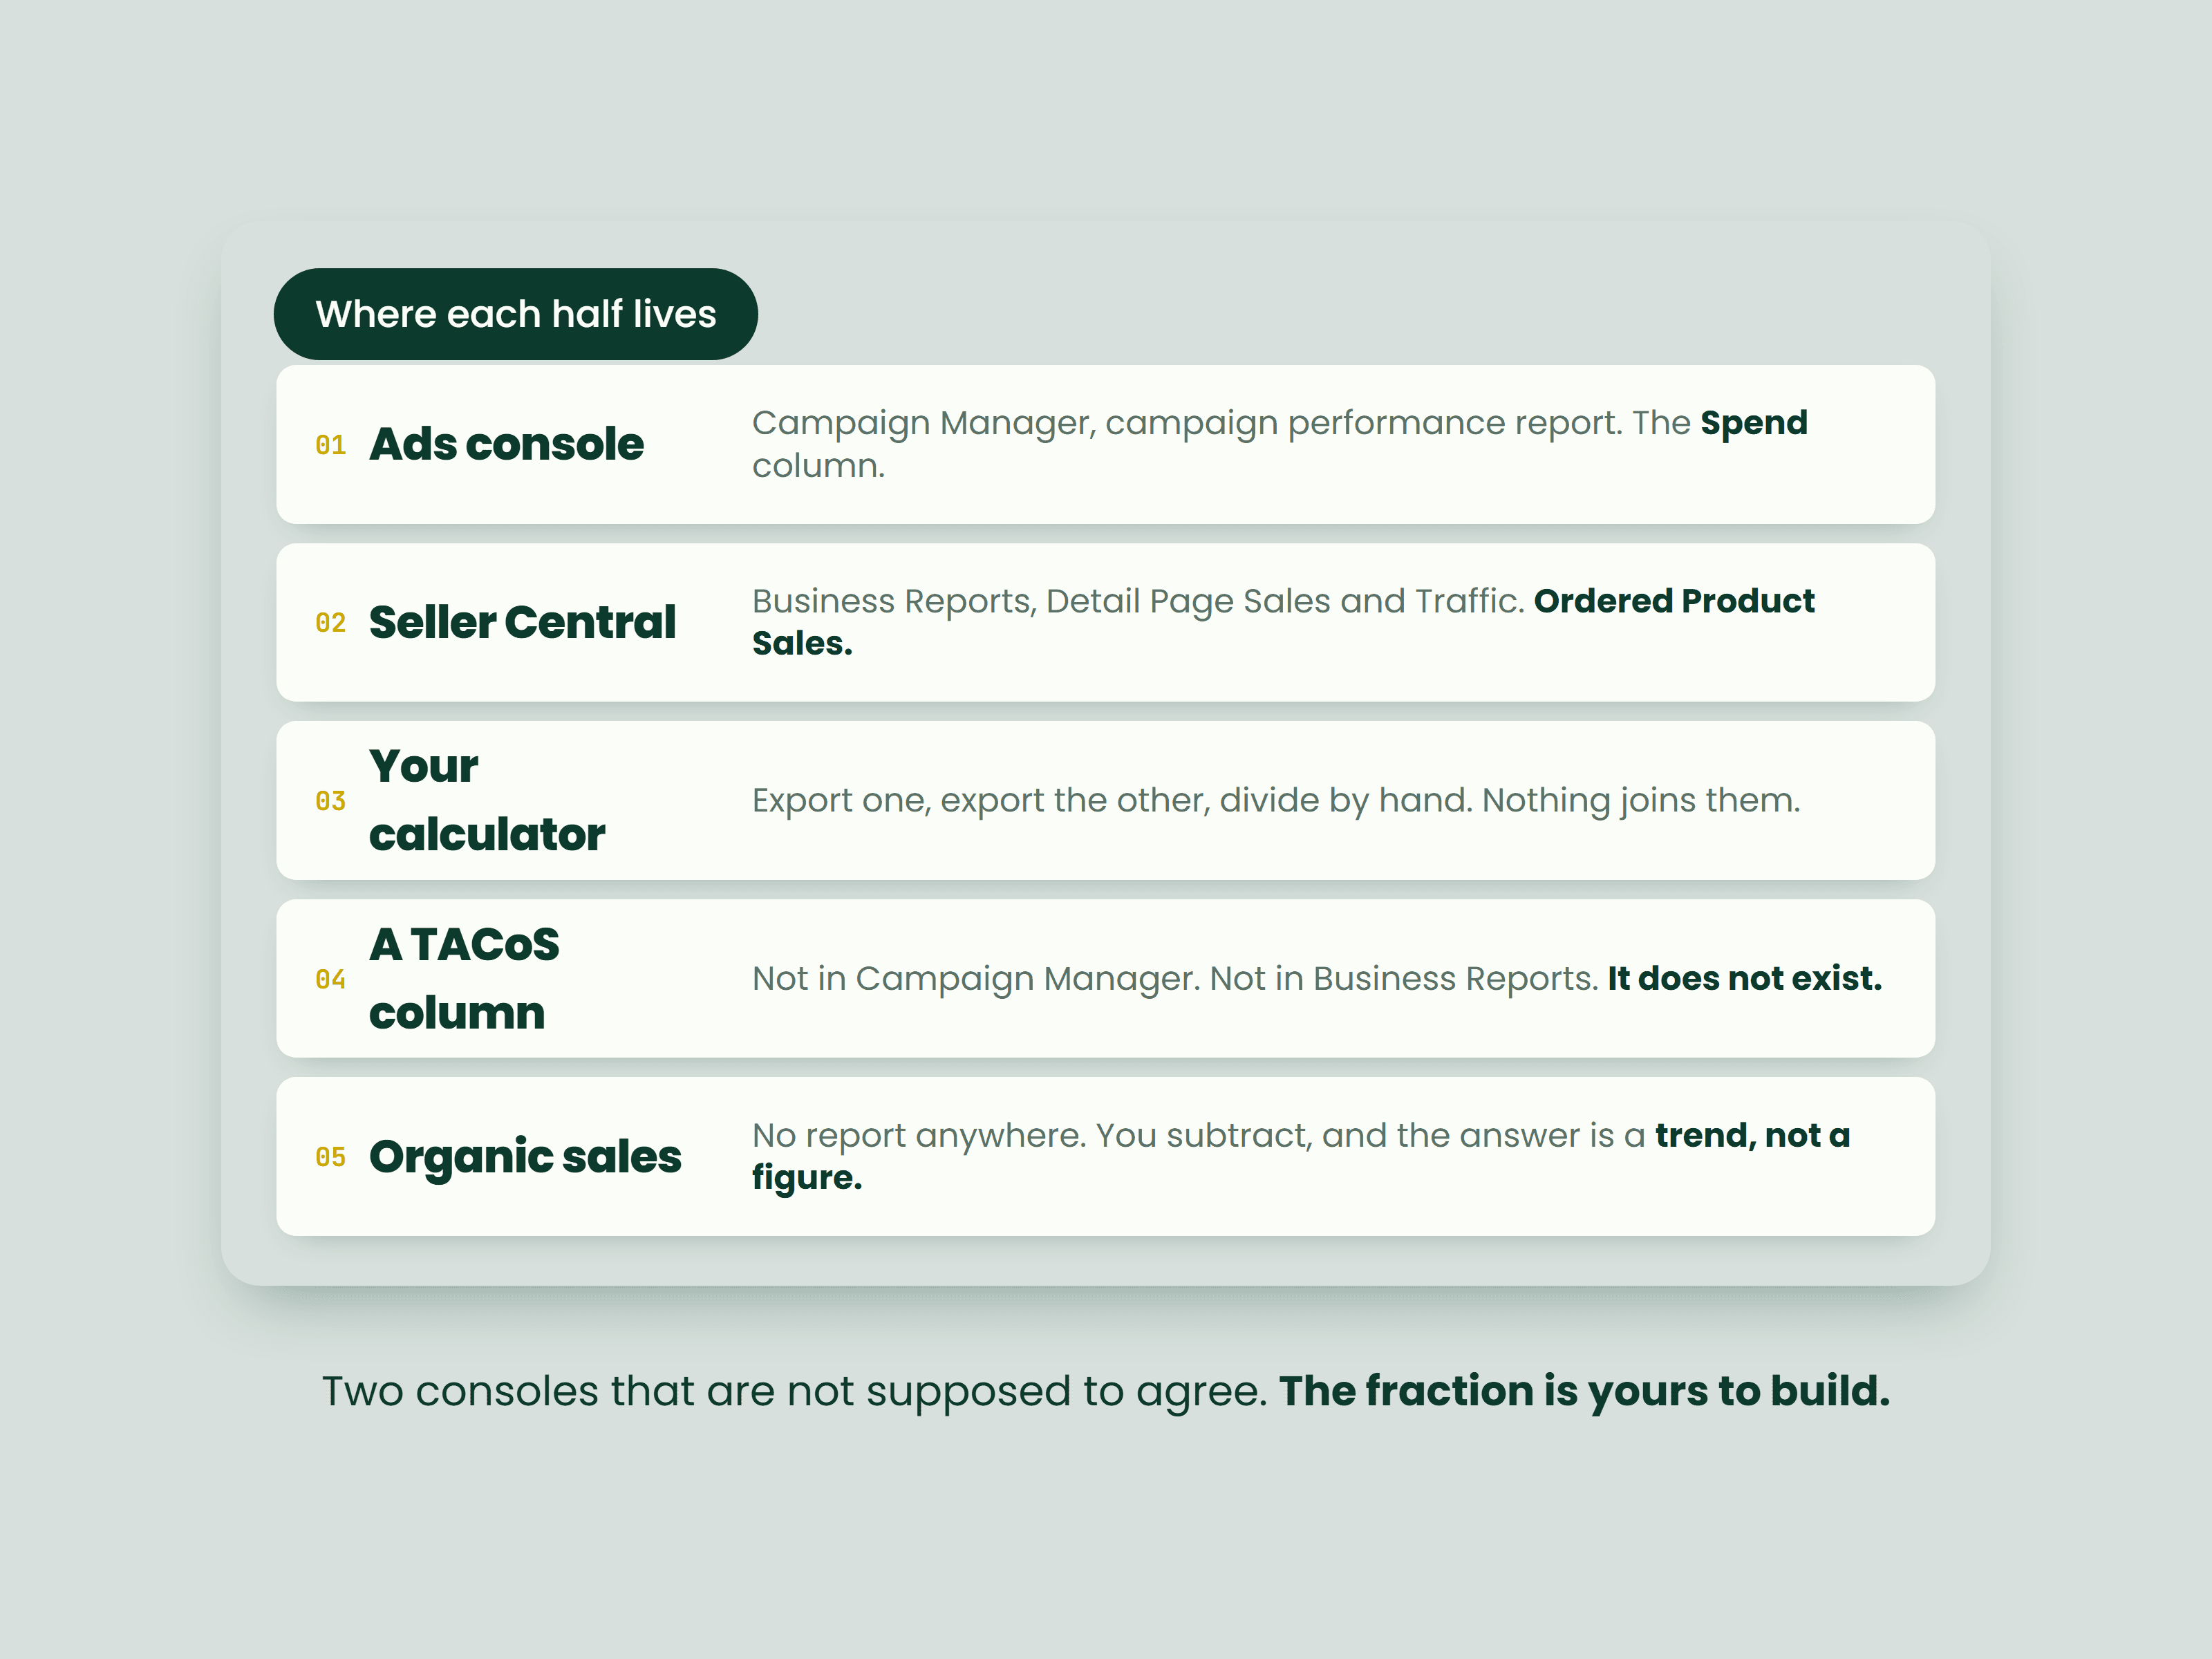
Amazon does not display TACoS. No TACoS column in Campaign Manager, no TACoS field in Business Reports, no report anywhere that calculates it for you. Every TACoS figure you have seen was built by a seller, an agency or a third-party tool, from two numbers pulled off two different screens.
The numerator lives in the Amazon Ads console. Campaign Manager, then a campaign performance report for Sponsored Products, Sponsored Brands or Sponsored Display, and the column you want is Spend.
The denominator lives in Seller Central. Reports, then Business Reports, then Detail Page Sales and Traffic. The column you want is Ordered Product Sales.
Two consoles. No report joins them. You export one, export the other, and divide by hand.
That also answers why the Business Report and the ads report never agree on sales. Ordered Product Sales counts what customers ordered in the period you selected. Ad-attributed sales counts orders credited back to a click that may have happened days earlier. They are not supposed to match, and a tool presenting them as if they were is hiding the interesting part.
Ad spend going up but sales not increasing on Amazon
The pattern that worries people has three moving parts, and all three have to be present. Ad spend climbing. Total sales flat. Organic sales falling to make room for the paid ones.
Together that means advertising is buying revenue the listing used to get for nothing, and the total stands still while the cost of holding it goes up. That is renting.
Growing is the opposite. Total sales rise while the share of them that needs an ad to happen goes down. TACoS falls there as a byproduct, which is why chasing the byproduct directly is such an expensive mistake.
Four reasons your TACoS is rising that are not renting
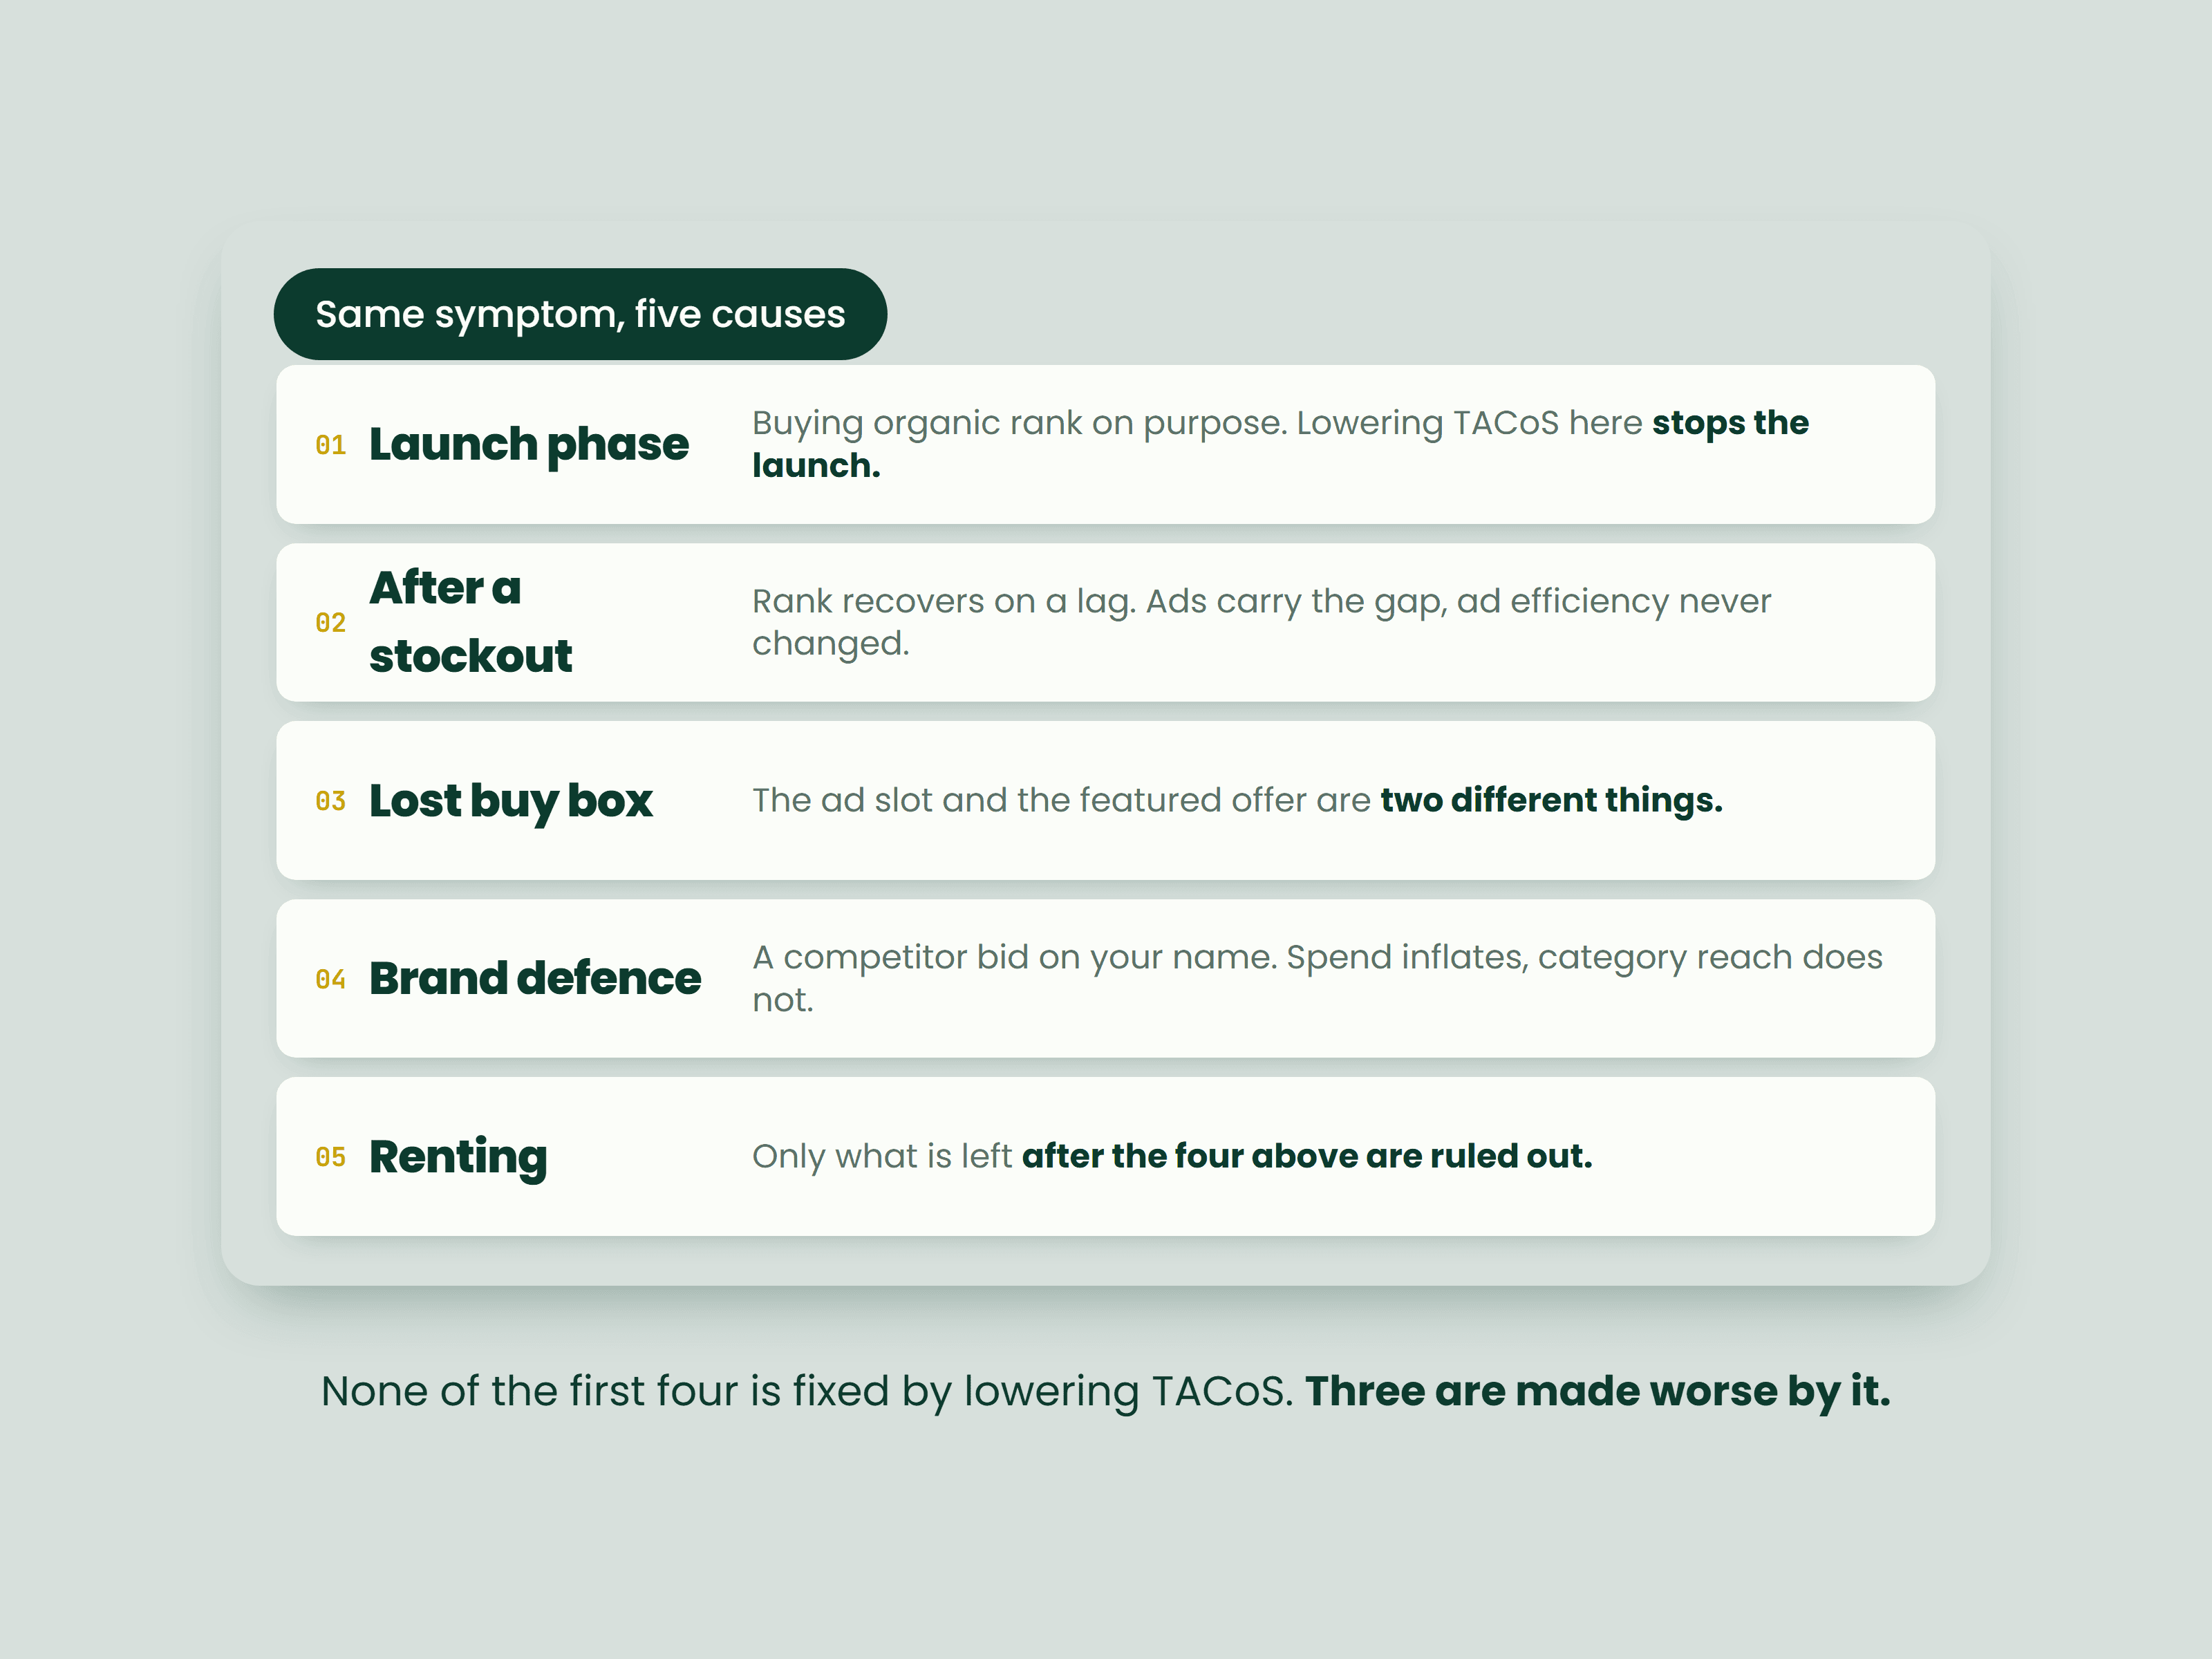
Here is where most content on this topic goes wrong. It treats the pattern as a diagnosis. It is a symptom, and four legitimate explanations produce the identical symptom on a healthy account.
You are in launch phase and buying organic rank on purpose
A new ASIN has no sales history, so it has no organic position, so advertising is the only traffic it gets. Spend runs high against a small total and TACoS looks alarming. That is the intended shape of a launch. Ad budget converts into sales velocity, and velocity buys the organic position you will live on later. Lowering TACoS here means stopping the launch.
You restocked and organic rank has not caught up yet
A stockout costs sales velocity, and organic rank follows velocity down. When stock returns, rank recovers on a lag. During that lag the ads are doing work the organic position used to do, so sales look disproportionately ad-driven and TACoS rises with no change in ad efficiency at all. Check inventory history for the window before calling anything renting.
You lost the buy box and your ads kept spending
The ad slot and the featured offer are two different things. Your Sponsored Products ad keeps serving and keeps charging you for clicks while somebody else holds the buy box on the page those clicks land on. The shopper arrives, the default buy button is not yours, conversion collapses, and spend carries on accruing.
TACoS rises and it looks like an ad problem. The fault is upstream in buy box eligibility, which is a question about price, fulfilment and account health rather than bids. Buy box percentage sits in Business Reports. Read it before you touch the ad account.
A competitor is bidding on your brand name
If someone starts advertising against searches for your brand, defensive spend on your own branded terms goes up to hold a position you already owned. Ad spend inflates. Category reach does not. That is a completely different problem from ads failing to convert into organic rank.
None of these four is fixed by lowering TACoS. Three are made worse by it.
The four checks that separate renting from growing
Renting is not a number. It is a combination. Rising TACoS plus organic sales falling plus non-branded share falling plus no stockout in the window plus no buy box loss is renting. Take any one away and you are looking at something else.
Organic sales trend. Total sales minus ad-attributed sales, tracked over time rather than read as a single figure. The next section explains why the trend is trustworthy and the absolute number is not.
Keyword rank. Where you actually sit organically on the terms that matter, and which way that has been moving. Amazon publishes no organic rank field anywhere, so this comes from a rank tracker rather than a native report.
Conversion rate. In Business Reports this is Unit Session Percentage, the share of visits to your detail page that end in a unit sold. If it is falling, the same sales now need more clicks to close, and more clicks cost more money at any bid. A listing problem wearing an ad problem's clothes.
Branded versus non-branded split. This lives in Search Query Performance, under Brands, then Brand Analytics, then Search Query Performance. It requires Brand Registry.
One clarification that vendor content gets wrong often enough to state plainly. The Search Term Report in the Sponsored Products console and the Search Query Performance report in Brand Analytics are different tools. The Search Term Report shows paid clicks only and needs no Brand Registry. Search Query Performance covers the whole query, paid and organic together, and is gated behind Brand Registry. Only the second one shows whether your branded share is holding while your non-branded share slides, which is the split that separates renting from defending.
Where the thresholds sit, and how much movement counts as signal rather than noise, is the part I keep. The shape is the part worth taking. One flag is noise. Correlated flags are a finding.
What is a good TACoS on Amazon? Nobody can tell you
Every article on this subject offers a healthy range by category or lifecycle stage. I went looking for the source of those numbers and could not find one.
The ranges contradict each other under the same label. Launch phase appears as fifteen to twenty-five percent on one blog and twenty-five to fifty on another. None names a dataset, a sample size or a methodology. When several sources publish different numbers under one heading with no working shown, the disagreement is the evidence.
There is no credible published benchmark. Your comparison is your own account last quarter, on the same method, with the same product mix. Weaker than a benchmark, and the only honest answer available.
How to calculate organic sales on Amazon, and why the number is a proxy
Amazon publishes no organic sales report. A seller who asked Amazon Ads support for one directly was pointed at generic order reports and date range reports, because a dedicated organic view does not exist.
So the calculation everybody uses is a subtraction. Total sales from Business Reports, minus ad-attributed sales from the ads console, and whatever is left gets called organic. Reasonable proxy, not an audited figure. Three things bend it.
Attribution windows do not line up with your sales period. Sponsored Products attributes over seven days on a Seller Central account and fourteen on a Vendor Central one. Sponsored Brands runs fourteen. Extended windows live in the downloadable campaign performance report, not the default console view. So a sale credited to your spend this month may trace to a click from last month, and the subtraction inherits that mismatch.
Ad-attributed sales include halo sales. A click on one ASIN that ends in a purchase of a different ASIN in your catalogue can still be credited to that ad, so the number you are subtracting is not purely the advertised product.
And the methodology underneath the whole thing moved on 1 January 2026.
Treat organic as a trend read. Apply the same method every period and the direction it moves is meaningful. Do not publish it as an exact share of revenue, and do not build a forecast on it.
The 1 January 2026 attribution change that makes organic sales look better
This is the trap that will catch people quietly all year.
Before 1 January 2026, Sponsored Brands, Sponsored Display and DSP store-serving ads used a blind fourteen-day view-through window. If a shopper saw an ad and bought within fourteen days, the sale was credited as ad-attributed whether or not the view had influenced anything.
On 1 January 2026 Amazon replaced that with a shopping-signal enhanced last-touch model. View credit now runs through a model that only counts views tied to identifiable discovery behaviour, over a shorter effective window. Sponsored Products click attribution is explicitly unchanged.
Fewer view-through sales get counted as ad-attributed. Now run the standard subtraction across that January boundary on an account with meaningful Sponsored Brands, Sponsored Display or DSP spend. Ad-attributed sales fall, so the organic residual rises, and your organic trend line shows a recovery that nothing in the account produced.
Accounts running Sponsored Products only are largely insulated. Any brand with SB, SD or DSP in the mix needs this flagged before the organic trend is trusted across January, and anyone who told you your organic sales recovered at the start of the year owes you a sentence about whether they knew this had happened.
Cut PPC spend and organic sales disappeared
The instinct when TACoS rises is to cut spend, because spend is the numerator and cutting it makes the number smaller today.
The mechanism that punishes this is the one that makes a launch work. Ad-driven units are part of the sales velocity holding your organic position up. Cut the spend, units fall, organic rank slides a few days later, and the organic traffic meant to replace the paid traffic shrinks as well. Total sales drop, and since TACoS is a ratio, a falling denominator can raise the number even as spend comes down.
A seller reported exactly this on Amazon's own forums after pulling their ACoS down aggressively, and an Amazon Ads support reply pointed at the same velocity mechanism. Not a controlled study. Corroboration from a source with no product to sell.
Be careful with the other tempting explanation, category-wide cost per click inflation. It gets asserted constantly and I could not find a dated, credible study behind any figure in circulation. The version you can act on is to pull your own category's CPC trend from your campaign performance reports and read your numbers, not the industry's.
What else moves TACoS: buy box, stockouts, conversion rate, reviews and price
TACoS is a ratio of two numbers, and several account signals move those numbers without touching the ads at all. Reading it alone is the single-lever mistake this article exists to correct.
Buy box win rate sits against ad efficiency, because ads serve and spend regardless of whether you hold the featured offer. Inventory history sits against organic rank recovery, because a stockout inside the window explains the whole pattern on its own. Unit Session Percentage sits against clicks needed per sale, because conversion is the thing between ad spend and total sales. Review velocity and rating sit three steps upstream, since a rating slip hits conversion first and conversion carries the ratio. Competitor entry on branded terms decides whether rising spend is failure or defence. Price history decides what flat total sales even means, because a price rise can hold revenue while units fall, or the reverse.
Any one of those moving is noise. Several moving together is a cause. That is the difference between a report telling you TACoS went up and a diagnosis telling you why.
What this decides: whether your next ad dollar buys rank or rent
Strip out the mechanics and one decision is left.
Every dollar of ad spend either buys a position you keep or rents one you already had. Launch spend buys. Post-stockout recovery spend buys, temporarily, while rank climbs back. Branded defensive spend rents, deliberately, and sometimes that rent is worth paying because the alternative is handing the term to somebody bidding on your name. Spend propping up a listing whose conversion rate is quietly falling rents, and the rent goes up every month nobody looks at the listing.
TACoS cannot tell you which of those you are buying. It moves for at least six reasons. The four checks tell you, and they tell you before the decision gets expensive.
So the useful question is not how to get TACoS down. It is which of your ASINs is renting, what that rent costs per month, and whether the same budget would buy more somewhere else. That is a budget allocation decision, and it is answerable.
If you want to know which of your ASINs is paying rent, that is one of the reads a full account audit pulls apart. You keep the numbers either way.
Frequently asked questions
Why is my TACoS going up when my sales are flat?
Because advertising is covering revenue the listing used to bring in on its own, or because something upstream of the ads changed. The pattern has at least five causes, including a launch, a post-stockout rank recovery, a lost buy box, a competitor bidding on your brand name, and genuine ad dependence. The four checks that separate them are organic sales trend, keyword rank, Unit Session Percentage, and the branded versus non-branded split in Search Query Performance.
Does Amazon show TACoS anywhere?
No. There is no TACoS column in Campaign Manager and no TACoS field in Business Reports. You pull Spend from a campaign performance report in the Amazon Ads console, pull Ordered Product Sales from Business Reports in Seller Central, and divide one by the other yourself. No native report joins the two.
How do I calculate organic sales on Amazon?
Total sales minus ad-attributed sales. Amazon publishes no organic sales report, so this subtraction is the only route, and it is a proxy rather than an audited number. Attribution windows do not align with your sales period, and ad-attributed sales include halo purchases of other ASINs. Use it as a trend with a consistent method, not as an exact share of revenue.
Why did my organic sales jump in January 2026?
Possibly because of a reporting change rather than anything in your account. On 1 January 2026 Amazon replaced the blind fourteen-day view-through window with a shopping-signal enhanced last-touch model for Sponsored Brands, Sponsored Display and DSP. Fewer view-through sales are counted as ad-attributed, so the organic residual in the standard subtraction rises. Sponsored Products click attribution did not change, so SP-only accounts are largely unaffected.
I cut my PPC spend and my organic sales disappeared. What happened?
Ad-driven units were contributing to the sales velocity holding your organic rank up. Cutting spend dropped units, rank followed, and the organic traffic that was supposed to replace the paid traffic shrank instead. A seller described this sequence on Amazon's own forums with an Amazon Ads support reply attached. It is why cutting spend to fix a TACoS number can raise the number.
What is a good TACoS for Amazon?
There is no credible published benchmark. The ranges in circulation contradict each other for the same lifecycle stage and none publishes a dataset or a methodology. Your comparison is your own account in a prior period, measured the same way, with a similar product mix.
Sources
Primary, Amazon's own pages
View attribution updates for Amazon store ads, Amazon Ads, 1 January 2026. The shopping-signal enhanced last-touch model, the Sponsored Brands, Sponsored Display and DSP scope, and the statement that click attribution is unchanged.
Seller Central forum thread on organic sales disappearing after an aggressive ACoS cut, with an Amazon Ads support reply. Dated only by relative post age, so no calendar date is claimed above.
Seller Central forum thread asking for an organic sales report, where an Amazon representative redirects to order and date range reports. Confirms no native organic sales view exists.
Secondary, used for mechanics that were cross-checked and did not disagree
SellerApp, Perpetua, Keywords.am and Novadata on the TACoS calculation and the two console locations.
Jungle Scout on Seller Central report paths.
Feedvisor and BidX on attribution windows and halo sales.
GigaBrands and Parker-Lambert on Search Query Performance, and Amazon's Brand Registry requirements for Brand Analytics.
ppc.land on the January 2026 view attribution change, corroborating the primary source from trade press.
Checked and excluded
Every TACoS benchmark by category or lifecycle stage. Internally contradictory across sources, no primary dataset, no methodology.
All circulating CPC inflation percentages and average CPC figures. Unsourced at the primary-looking source and contradicted within the same search results.
The halo effect percentage. The mechanism is documented, the number is sourced only to informal conversation.
Dollar figures from the chasing-TACoS anecdote. The mechanism is corroborated independently, the numbers are not.
Onieque Edwards
Content Strategist /Blog Writer
Onieque is the brain behind bold Amazon growth strategies and structured business execution. He enjoys turning scattered ideas into clear, actionable systems that actually drive results. When he’s not building out growth plans or refining campaigns, you’ll likely find him exploring new coffee spots or getting lost in ideas that connect strategy with creativity.